
Harnessing Mobility Data in Thailand
While Thailand has been successful at managing the Coronavirus pandemic the economic toll has been high with a sharp decline in international tourist arrivals and falling private investment leading to a forecasted -7.3% contraction of GDP in 2020.
27th November 2020 • International

As the country introduces measures to stimulate economic recovery, investment in network growth will be back on the agenda for a number of our retail clients, who see major opportunities in this large and exciting market. However, as anyone who has undertaken network planning work in the country will know, Thailand is famously challenging from a data perspective with a dearth of sources of reliable data at a level of granularity sufficient to support critical investment decisions.
For this reason Geolytix have been interrogating mobility data in Thailand, provided by our partner Unacast, to establish how it can help drive insights into shopping, work, and travel behaviour, with a particular focus at the moment on how patterns are evolving post-Covid. Chonburi Province to the South East of Bangkok provides an interesting case study given its fast growing population, high tourist volumes (in normal times), and diverse industrial landscape including Thailand’s primary seaport at Laem Chabang and manufacturing facilities of multinationals (and associated foreign communities) in and around nearby Siracha.
Geolytix have aggregated Thai mobile device data gathered by Unacast to hex-grids which allows us to map activity levels over time as well as understand work and travel patterns (as the mobile device data contains both a home location and a workplace flag).
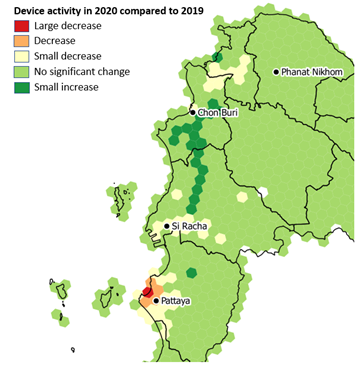
The data reveals that Pattaya has unsurprisingly been hit the hardest in terms of reduction in activity, largely due to international tourist numbers falling to effectively zero. We see a slight increase in domestic visitors to the resort (defined as individuals with a home location greater than 100km away, so including weekend visitors from Bangkok) but far from enough to compensate.
Further north in the manufacturing zones around Siracha we also see a drop-off in activity in 2020 compared with 2019. However further north in Chonburi city itself activity levels are actually slightly higher in 2020.
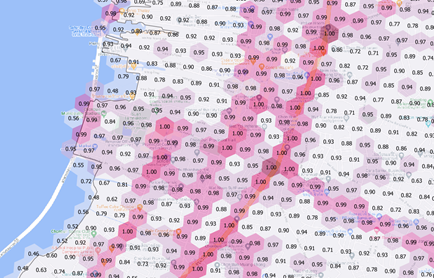
On a more granular level the data can be used as a proxy for footfall to support individual store investment decisions. The hex-grids in the example below are shaded based on the level of activity with the label indicating a Geolytix-derived score for each cell.
We are seeing growing interest in mobility data, in the UK and other markets, either on its own or as an input into a spatial model. Based on our exploratory analysis Thailand looks like another market where this data can provide a boost to retailers in gaining a deeper understanding of consumer movement and the evolution of work, shopping, and leisure behaviour patterns.
Luke Whittam, Business Development Director at GEOLYTIX
Photo by Braden Jarvis on Unsplash

Related Posts
-

From Footsteps to Forecasts: The Power of Small Area Footfall
Discover how Geolytix footfall data can transform the way you understand your locations and identify where to open next.
Published 30th May 2025 • Tags mobility, geodata
-

Interaction Surfaces explained: Why Context is Everything
Christoph Mülligann, Chief Innovator at Geolytix, takes us behind the curtain of developing Interaction Surfaces and gives us his unique take on making sense of mobile data.
Published 31st May 2024 • Tags geodata, mobility, mapp, ai
-

Interaction Surfaces: How to maximise store density and minimise overlap
If it was possible to maintain 3 successful stores in one area instead of 2, wouldn’t you want to know?
Published 29th May 2024 • Tags geodata, mapp, mobility